
Main conclusion
The earlier advantage did not reappear.
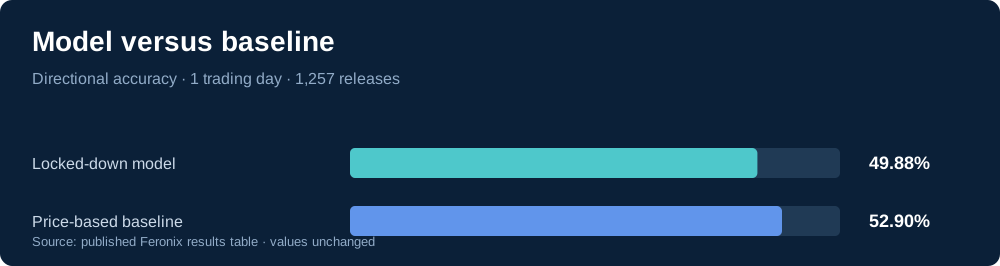
The model did not exceed 50% accuracy in the independent primary test. The earlier result of 55.93% was not replicated, and selected signals were not positive on average after costs.
Study overview
The study’s scope at a glance.
Source
Earnings releases filed under SEC Form 8-K
Study design
External replication with the model locked down in advance
Target measure
Sector-adjusted return over 1 day
Comparison
Fixed baseline and 50% directional accuracy
What did we want to find out?
The initial study found an interesting one-day signal in interpretable earnings-release features. The real question was not whether this result looked attractive, but whether it would reappear for companies never used in model development.
One model was therefore locked down in advance: Ridge with alpha 100, the same features, the same horizon and the same signal thresholds.
How was it tested?
New companies
The replication used 300 companies selected in advance from outside the original group. The primary test contained 1,257 usable releases from 296 companies.
New time period
The primary test began on 25 September 2025. Both the companies and the time period were therefore new.
Fair execution
Positions were opened no earlier than the close of the first subsequent trading day. Returns were market- and sector-adjusted, and 10 basis points of costs were charged to each strong signal.
Key results
Directional accuracy was below the fixed baseline, and the intervals were compatible with chance performance. There was no stable pattern by year either.
| Measure | Outcome | Interpretation |
|---|---|---|
| Directional accuracy | 49.88% | No better than 50% |
| 95% interval | 47.20–52.51% | Compatible with chance |
| Baseline | 52.90% | Higher than the model |
| Strong signals | 528 | Prespecified threshold |
| Net return per signal | −0.15% | After 10 bp of costs |
Example predictions
The rows below illustrate how a prediction is recorded. ‘Up/down’ comes directly from the locked-down model; ‘actual’ is the subsequent sector-adjusted return.
| Company | Date | Prediction | Actual | Correct direction? |
|---|---|---|---|---|
| Analog Devices | 24 Nov 2021 | −0.38% · down | −0.09% | Yes |
| Autodesk | 24 Nov 2021 | −0.16% · down | +1.30% | No |
| Best Buy | 24 Nov 2021 | +0.09% · up | +0.83% | Yes |
| Burlington Stores | 24 Nov 2021 | −0.27% · down | +0.33% | No |
| Dell Technologies | 24 Nov 2021 | −0.37% · down | +0.41% | No |
Example rows from the secondary full period. The main conclusion uses only the prespecified primary holdout.
What should you not infer?
- The sample mainly contains liquid, continuously listed companies.
- The text features capture complex language less deeply than a modern large language model.
- Sector adjustment using ETFs is an approximation, and actual execution prices are not available.
Research findings, not investment advice. Historical relationships do not guarantee future results.