
Main conclusion
No directly tradable oil-to-Shell signal.
None of the tested configurations remained positive on the untouched holdout after the assumed transaction costs. On average, oil variables were no more predictive than Shell’s own recent price history.
Study overview
The study’s scope at a glance.
Source
WTI futures and SHEL one-minute candles
Study design
Chronological training, validation and holdout split
Target measure
Return over 5, 10, 15 and 30 minutes
Comparison
Shell only, oil only and combined
What did we want to find out?
Oil and energy stocks often move together. But does Shell follow oil in a way that allows completed one-minute data to predict the next 5 to 30 minutes?
The analysis used regular US trading hours and prevented returns from crossing trading-day boundaries.
How was it tested?
Chronological separation
Training ran until 4 December 2025, validation until 30 April 2026, and the completely untouched holdout began on 1 May 2026.
Four model types
Ridge models using oil only, Shell only or both were compared with gradient boosting and a constant baseline.
Conservative backtest
Only predictions above the validation threshold were traded. Overlapping positions were not allowed, and 10 basis points were deducted per trade.
Key results
The best predictive configuration was Ridge using Shell and oil over 30 minutes. The correlation was 0.0661, but the backtest remained negative after costs.
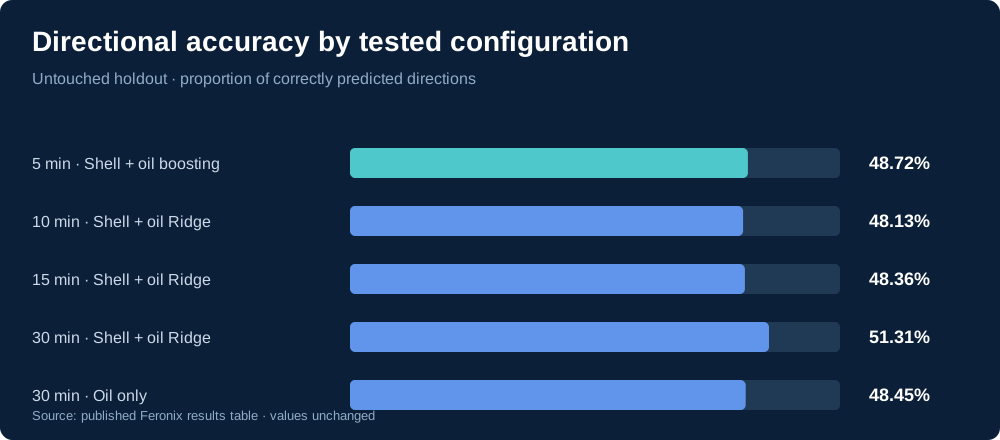
| Horizon | Model | Directional accuracy | Correlation | Net |
|---|---|---|---|---|
| 5 min | Shell + oil boosting | 48.72% | 0.0064 | −99.55% |
| 10 min | Shell + oil Ridge | 48.13% | −0.0079 | −44.99% |
| 15 min | Shell + oil Ridge | 48.36% | 0.0023 | −32.14% |
| 30 min | Shell + oil Ridge | 51.31% | 0.0661 | −15.51% |
| 30 min | Oil only | 48.45% | −0.0049 | −11.74% |
Example predictions
The models produced an expected future return for each minute. The table summarises a separate top-20% signal rule for each horizon. The −70.06% result for the 5-minute rule is therefore not the same as −99.55% for Shell + oil boosting in the model comparison above: these are different configurations. The available export contains aggregated backtest results, not individual one-minute predictions.
| Horizon | Signal threshold | Trades | Gross | After costs |
|---|---|---|---|---|
| 5 min | Top 20% | 1,201 | −0.49% | −70.06% |
| 10 min | Top 20% | 607 | +0.94% | −44.99% |
| 15 min | Top 20% | 380 | −0.77% | −32.14% |
| 30 min | Top 20% | 189 | +2.06% | −15.51% |
What should you not infer?
- SHEL is a US-listed ADR; WTI is not the same as Brent.
- One-minute candles do not contain historical bid–ask spreads or precise execution prices.
- With multiple models and horizons tested, the best result may partly reflect chance.
Research findings, not investment advice. Historical relationships do not guarantee future results.