
Main conclusion
No convincing advantage from clusters or the model.
Clusters had a positive average abnormal return, but the interval included zero. The selected model’s accuracy remained below 50%, and selected signals lost money on average after costs.
Study overview
The study’s scope at a glance.
Source
SEC Form 4 open-market purchases
Study design
Event study with a reserved test period
Target measure
Sector-adjusted return over 5–60 days
Comparison
Individual purchases, clusters and a prediction model
What did we want to find out?
An insider purchase may signal confidence. Is a group of insiders buying within a short period more informative than a single purchase?
Only open-market purchases with transaction code P, a positive price and a positive number of shares were included.
How was it tested?
Cluster definition
At least two different insiders within seven calendar days, followed by a twenty-day waiting period to prevent overlap.
A fair starting point
Positions were opened no earlier than the opening of the first trading day after the filing date.
Reserved test period
Training ended before 2025. The model was selected during validation; the primary test began on 1 July 2025.
Key results
Over 60 days, clusters had higher average returns than individual purchases, but the proportion of positive outcomes remained below 50% and uncertainty was substantial.
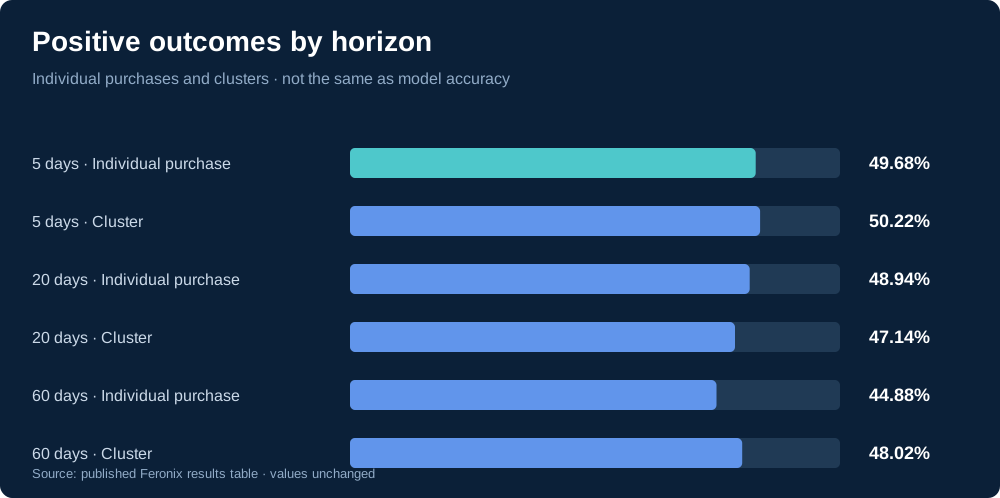
| Horizon | Type | Events | Mean abnormal return | Positive |
|---|---|---|---|---|
| 5 days | Individual purchase | 1,083 | +0.18% | 49.68% |
| 5 days | Cluster | 227 | +0.14% | 50.22% |
| 20 days | Individual purchase | 1,083 | +0.54% | 48.94% |
| 20 days | Cluster | 227 | +0.79% | 47.14% |
| 60 days | Individual purchase | 1,083 | −0.53% | 44.88% |
| 60 days | Cluster | 227 | +1.35% | 48.02% |
Example predictions
Examples from the reserved holdout. ‘Predicted’ is the expected sector-adjusted 20-day return; net returns include 10 basis points of costs.
| Company | Cluster? | Predicted | Actual | Net signal return |
|---|---|---|---|---|
| GameStop | No | −2.93% | −6.88% | +6.78% |
| Hilton | No | −1.64% | −1.04% | +0.94% |
| Simon Property | Yes | −1.88% | +0.36% | −0.46% |
| Asana | No | +3.28% | +0.77% | +0.67% |
| Constellation Brands | No | +3.29% | +0.77% | +0.67% |
What should you not infer?
- The SEC bulk data does not include an exact acceptance timestamp.
- Small and delisted companies are underrepresented.
- Insider purchases can have many motivations and do not establish that the buyer had inside information.
Research findings, not investment advice. Historical relationships do not guarantee future results.