
Main conclusion
An interesting initial signal, but not yet evidence.
The best signal was positive on average after costs, but every uncertainty interval included zero. Text helped most over twenty days, but did not consistently outperform the price-based baseline.
Study overview
The study’s scope at a glance.
Source
Official earnings releases filed under SEC Form 8-K
Study design
Chronological training, validation and holdout split
Target measure
Abnormal returns after 1, 5 and 20 days
Comparison
Price-based baseline, text rules and TF-IDF
What did we want to find out?
Can the language in official earnings releases add value beyond recent price reactions, momentum, volatility and volume?
The target variable was the market- and sector-adjusted return over 1, 5 or 20 trading days. Positions were opened no earlier than the close of the first subsequent trading day.
How was it tested?
Three model groups
A price-based baseline was compared with interpretable text features and a locally run TF-IDF text model.
No future knowledge in the model
All language processing ran locally. No external model that might contain later knowledge about the companies was used.
Time-based holdout
398 events were used for training, 91 for validation and 118 as a completely untouched holdout.
Key results
The interpretable text features achieved 55.93% directional accuracy over one day. Because this finding emerged after testing multiple variants, a larger independent replication followed.
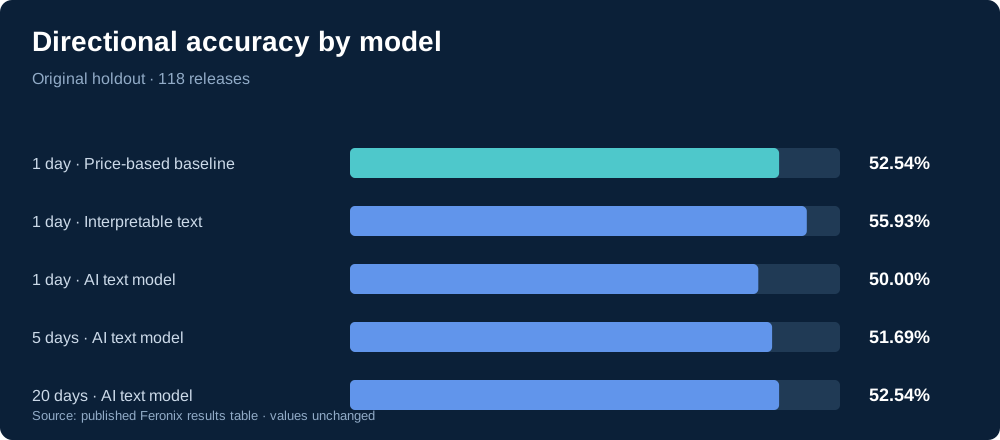
| Horizon | Model | Directional accuracy | Rank correlation | Net return/signal |
|---|---|---|---|---|
| 1 day | Price-based baseline | 52.54% | 0.087 | +0.03% |
| 1 day | Interpretable text | 55.93% | 0.059 | +0.36% |
| 1 day | AI text model | 50.00% | 0.043 | +0.07% |
| 5 days | AI text model | 51.69% | −0.002 | +0.45% |
| 20 days | AI text model | 52.54% | 0.083 | +0.24% |
Example predictions
Selected holdout rows from the price-based baseline. A signal of +1 means long, −1 means short and 0 means no trade. Signal thresholds follow the validation distribution, so a slightly negative prediction can still fall into the relatively high group. Actual returns are sector- and market-adjusted.
| Company | Entry date | Predicted | Signal | Actual net return |
|---|---|---|---|---|
| Goldman Sachs | 15 Oct 2025 | −0.07% | None | — |
| Bank of America | 16 Oct 2025 | −0.24% | Short | −1.08% |
| Coca-Cola | 22 Oct 2025 | −0.04% | Long | −1.38% |
| Tesla | 23 Oct 2025 | −0.05% | Long | −3.76% |
| Intel | 24 Oct 2025 | +0.02% | Long | +1.68% |
What should you not infer?
- Fixed text rules may miss some press releases.
- TF-IDF recognises patterns but does not understand language in the way a modern language model does.
- The small holdout and multiple model variants increase the risk of chance findings.
Research findings, not investment advice. Historical relationships do not guarantee future results.